


IMA Analysis
Thursday March 18, 2021
Board Pay vs Performance
Insights from IMA India’s 2020 Executive and Board Remuneration Report
To what extent are Board members and top executives rewarded for their company’s performance? Conventional wisdom holds that junior and middle manager compensation is based mainly on how well they do individually or as a team. On the other hand, pay in the upper echelons is supposed to be driven more by organisational performance. However, the reality may be less clear-cut. The 2020 edition of IMA India’s Executive and Board Remuneration Report examines trends in top-level compensation. Based on detailed pay data for 7 key positions across 1,585 India-listed companies and 252 unlisted companies, the report has some interesting findings on the pay-vs-performance debate. Among other things, it looks at how strongly changes in pay are correlated with changes in revenue and PAT (profit after tax). This paper highlights some of the key findings.
COMPENSATION VS PAT…
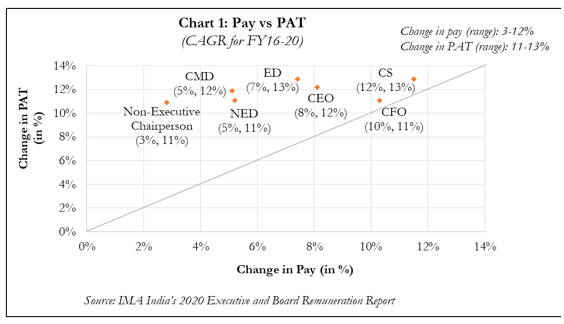
Compensation growth is not in congruence with growth in PAT
Over the last four years (FY16-FY20), PAT at an industry-wide level has generally risen faster than pay. Across all seven positions, the CAGR in pay is lower than that for PAT: 3-12% pa compared to 11-13% pa (see Chart 1). The gap is widest for Non-Executive Chairmen, who have recorded only a 3% compounded pay increase during this period, compared to an 11% growth in PAT for their companies. CMDs (Chairmen and Managing Directors) and NEDs (Non-Executive Directors) come next, with annual increases of ~5% each. Executive Directors do somewhat better, with a 7% annualised pay rise, CEOs are at 8% and CFOs at 10%. Interestingly, Company Secretary pay has grown the fastest (12% a year) during this period albeit from a low base.
…AND REVENUE
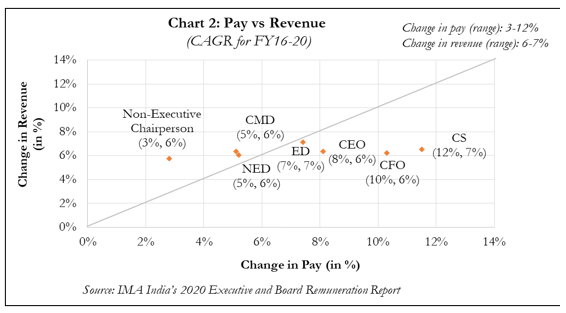
Change in revenue is commensurate with change in pay
While compensation has not kept pace with PAT growth, the relationship between pay and revenue is more complex. Pay growth for CMDs, NEDs and Non-Executive Chairmen lags that in revenue. However, across the four other executive positions we considered, pay has either kept pace with revenue growth (as is the case for EDs) or (in the case of CEOs and CFOs) significantly exceeded it (see Chart 2). Again, the gap is widest for Company Secretaries but this is probably the result of a low-base effect.
Growth in board pay moves more directly in line with top-line than bottom line growth
Clearly, multiple factors go into determining pay increases but revenue and profitability growth are important considerations for top management. The analysis above suggests that most Board members have, in the last four years, been rewarded more directly for growing the top-line than the bottom-line. Needless to say, there are significant sectoral variations but the overall trend is a departure from the one observed in previous years and, more than anything else, reflects a general moderation in Board compensation.
|
The contents of this paper are based on IMA India’s 2020 Executive and Board Remuneration report, published in February 2021. The report is available for purchase at a special price for members of IMA’s peer group forums at the following link https://www.ima-india.com/reports/DC_Report_2020/. Please visit www.ima-india.com to view current papers and our full archive of content, in the IMA members’ Knowledge Centre, accessible via the Login link on top of the page. A podcast version of this paper is also available there. IMA Forum members have personalised website access codes. |
Copyright ©️ 2021-22 INTERNATIONAL MARKET ASSESSMENT INDIA PRIVATE LIMITED. All rights reserved