IMA Analysis
Thursday October 15, 2020
Employment Trends - October 2020
Only the bravest statisticians dare to put an estimate on India’s employment and joblessness numbers. For many decades, the only available data came from infrequent household surveys conducted by the NSSO, which were typically released with a lag and were based on imprecise and outdated definitions. In 2017, IMA India published a report, The India Employment Report, based on raw data from multiple NSSO survey rounds, which attempted to provide a more realistic assessment of employment, including how a superficial reading of the NSSO reports can actually lead to flawed inferences. More recently, the CMIE (Centre for Monitoring Indian Economy) has been running a monthly survey that, among other things, tracks joblessness. However, the sheer volatility of these numbers – they surged from 7% in March to 27% at the height of the lockdown before dropping back to the 8-9% range a few weeks ago – and the fact that they are based on a sample survey, raises doubts. For many years, economists have been urging the Government to publish ‘hard’ data on employment to reduce the excessive reliance on survey-based estimations. In April 2018, this was finally commenced in a limited way with the EPFO (Employee Provident Fund Organisation) publishing monthly payroll data from September 2017 onwards. While this only covers the organised sector, it does offer a part glimpse into ground realities and, most importantly, does not suffer from the many limitations of survey-based data.
AN IMPORTANT NEW DATA SOURCE…
India lacks robust employment statistics
Globally, economists use a mix of unemployment filings and payroll data to estimate joblessness. In India, this is infeasible due to high levels of informal, part-time and self employment, most of which is not formally documented. Since late 2017, the EPFO has made available monthly data on new enrolments in its scheme as well as ‘drop-outs’ and re-enrolments.
The EPFO enrolment numbers do have some flaws…
The data is far from perfect: it only covers formal-sector workers who meet the eligibility criteria and includes temporary workers for whom EPF contributions may not be continuous throughout the year. Firm-level EPFO enrolment is mandatory for companies that employ more than 20 people (thus covering only a small share of Indian businesses), and at the individual level, for those earning less than Rs 15,000 a month. Of course, smaller organisations and higher-paid workers can (and often do) voluntarily enrol but even so, the EPFO services a minority of India’s working population. Further, the data does not explicitly mention the total number of active accounts or the actual monies being credited into employee accounts month on month, which could have provided a trend on earnings and incomes.
…THAT YIELDS USEFUL INSIGHTS
…but still yield a trove of information
Nonetheless, the time series does offer a clear, actionable and up-to-date picture of the direction of change, which is critically important in volatile times such as these. Moreover, because of clearly stated criteria, there are no ambiguities in the basic definition of what constituted an ‘employed’ person. Now extending back almost three years, the EPFO data point to several interesting trends.
Rising formal wage employment…
India is moving steadily towards formal employment…
Just before the lockdown, the economy was creating a million new formal sector jobs a month

First, since September 2017, there has been a steady rise in enrolment, both cumulatively (in total, 18 million new people have signed on since then) and on a monthly basis (Chart 1). Rising enrolment is not the same thing as rising employment since enrolments can also increase due to a shift from the informal to formal sector . But the data certainly indicates that India is witnessing a strong and steady increase in regular, formal wage employment. The trend-line of net new enrolment has steepened, from about 300,000 in late 2017 to nearly 1 million a month just before the lockdown. In FY19 – the first full year for which data is available – 6.8 million new members enrolled. The following year, this figure jumped by 16% to 7.9 million.
In the current financial year, April and May saw a sharp fall in net enrolment, but June and July witnessed a steep, V-shaped recovery. July’s figure of ~845,000 net new enrolees is in fact 22.5% higher than a year ago, though it is lower than in January or February. This reflects not just a continued ‘formalisation’ of the workforce but, more importantly, a faster-than-expected pick-up in business activity in the formal sector.
Reducing labour churn…
EPFO is finding greater acceptance as labour market churn is reducing

Second, the churn in the EPFO system is reducing. Chart 2 presents trend-lines for monthly exits and returns into the EPFO system, a crude proxy for job stability. With the re-join numbers rising and exits falling, it appears that labour-market churn may be declining and that social-security mechanisms such as the EPF may be finding more acceptance.
Rapid influx of young new workers
The age composition of new enrolment reflects a similar trend

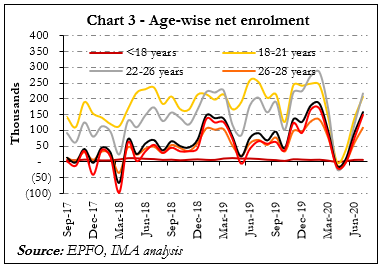
Third, net EPF enrolment has been rising the fastest among younger workers (18-21 and 22-26 – see Chart 3). Presumably, older workers who enrol in the EPF would have previously had some livelihood, implying that most new enrolment in these age groups is driven by a shift from the informal sector. On the other hand, the large numbers of young workers enrolling into the EPFO are mostly new entrants into workforce. This is a positive trend.
Improving female employment ratio
Women’s share of net EPFO enrolment has been remarkably steady

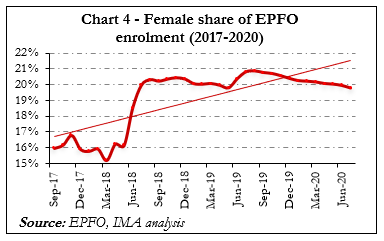
Finally, an important trend is that net new female EPFO enrolment, as a share of the total, has risen in the last three years. From about 16% in September 2017, women now make up 20% of the cumulative net new enrolment during this period. This is a significant increase considering the time frame involved and suggests that while women continue to be under-represented, they are entering the formal workforce at a faster rate than men. In a deeply-unequal ‘world of work’, this is a small mercy.
Copyright ©️ 2021-22 INTERNATIONAL MARKET ASSESSMENT INDIA PRIVATE LIMITED. All rights reserved


