


IMA Analysis
Wednesday March 17, 2021
Board Independence - March 2021
IMA India Research Update March 2021
Efforts to bring more Independent Directors (IDs) on the Board, which began as an exercise in compliance, have over the years evolved into a self-motivated drive to improve the quality and authority of Boards. As per the legal requirement, companies with an Executive Chairman are required to have an ID share of at least 50% on the Board but for those with a Non-Executive Chairman, the required ratio falls to 33%. However, IMA’s analysis, drawn from our recently published 2020 Executive and Board Remuneration report, which analyses Board compensation and non-compensation parameters for over 1,800 companies and 16,600 directors, finds that many companies still fall short of the regulatory norms on this count.
THE SEBI NORMS: A BRIDGE TOO FAR?
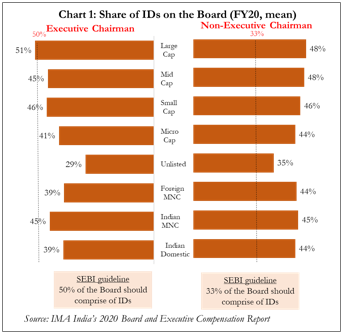
The average listed company in India has a 40% ID share on the Board
IMA’s analysis suggests that in FY20, on average, IDs made up 40% of the Board in private-sector listed companies. This ratio has risen only marginally, from 38% five years ago, suggesting that companies are not finding it easy to bring in more IDs. ID ratios are correlated with company size, exceeding 50% among large-cap private sector companies but dropping to 29% among unlisted companies. Further, being ‘independent’ in name is no guarantee of independence, even if it may be sufficient to tick the regulatory check-box. High levels of Board independence should be matched with sufficiently knowledgeable and engaged directors who can hold the management responsible for their actions. This is hard to ascertain from numerical analysis.
Many companies seem to struggle to ‘up’ their ID ratio
This might explain why many companies struggle to meet the SEBI norms around IDs, particularly among the 58% of firms that have an Executive Chairman. As Chart 1 shows, barring the large-caps (who barely scrape through at 51%), companies in most groups – whether categorised by ownership or market cap – fail to meet the 50% norm with an Executive Chairman. Mid- and small-caps achieve an average of 45-46%, while foreign MNCs and Indian pure-plays are currently at 39%. Given these realities, SEBI has extended the deadline for meeting the 50% threshold from April 2020 to April 2022. In comparison, across groups, companies with a Non-Executive Chair comfortably meet the 33% requirement. It might be argued that some firms may be appointing a Non-Exec Chair specifically to be able to ‘tick the box’ on ID compliance.
INCOME FROM ID ROLES: ANOTHER TELLING INDICATOR
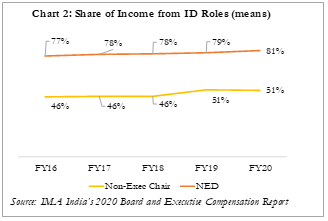
In FY20, NEDs on average earned 81% of their income from ID roles
A related issue is the income Directors earn from independent Board positions. In FY20, the average ‘specialist’ Non-Executive Director (those holding no known executive positions within the studied sample of companies) earned 81% of his/her total income, across one or more Board positions, from ID roles (the balance 19% of income came from non-independent, non-executive roles). This ratio was 77% four years ago. In comparison, Non-Executive Chairmen (who could hold executive positions in other firms) earned just over half their income from ID roles last year.
This could suggest that independence is getting compromised – but conversely, it might be an early indication of a new breed of professional IDs
It may be argued that having more of one’s income coming from ID roles is indicative of the rise of independent directorships as a specialist profession. But such individuals should be considered truly independent only if such income stemmed from multiple roles, thereby reducing the ID’s financial reliance on any one Board. However, the fact is, 75% of ‘specialist NEDs’ in our very extensive sample earned all of their known income from a single ID role, with an average share of 93% coming from a single organisation. It may be the case that many of these NEDs are retired, independently wealthy or have other sources of income that reduce or eliminate financial dependence on any individual Board position. However, in the absence of evidence to the contrary, the above numbers do raise concerns over the ‘financial independence’ of the average ID.
|
This paper is based on IMA India’s 2020 Executive and Board Remuneration report, a detailed analysis of compensation, performance, independence and composition of Boards amongst listed and unlisted companies in India. The analysis covers data for over 16,000 individuals across 1,800 companies in various industry sectors and across the market capitalisation spectrum. It presents data in highly segmented formats to enable both high level trend analysis as well as fine peer comparisons. The report is available for purchase from IMA’s offices or online at https://www.ima-india.com/reports/DC_Report_2020/ |
Copyright ©️ 2021-22 INTERNATIONAL MARKET ASSESSMENT INDIA PRIVATE LIMITED. All rights reserved